For this post we look at a famous but unofficial rule of wine ordering: The Second Cheapest Rule. The rule, as stated by Lettie Teague’s article “Some Wine Rules Are Made to Be Broken” states:
Another article also hints to the fact that some restaurants might include a higher priced item to the menu, to make the rest seem more affordable. The LAB TEAM took a deep dive on this issue, which we will explore and report over the next few weeks. Below is the initial report from the team.
Analyzing the Second Cheapest Rule is no small feat. Ideally we would like to know every price the user “saw” so we could verify if seeing a low price actually drives people to choose the second cheapest one. Since we don’t have that information, we started by comparing the average wine price of each of the wines the user “tapped” on, with the price of the wine that was eventually “selected”.
Our data comprised of users who tapped on at least 6 wines, plus selected one wine either while browsing or at the end of the process. We decided to further constrain the sample size to a selection of restaurants that have similar wine lists and users (average ticket price of the meal) to make it homogenous, reaching a total sample size of 2400 users.
This data set should allow us to find some clue that the cheapest wine customers see is actually a predictor of the wine they choose.
The Average Wine Consumer
The following chart shows the average price of each of the wines the user “saw” and the average price of the final selection. Prices have been anonymized.
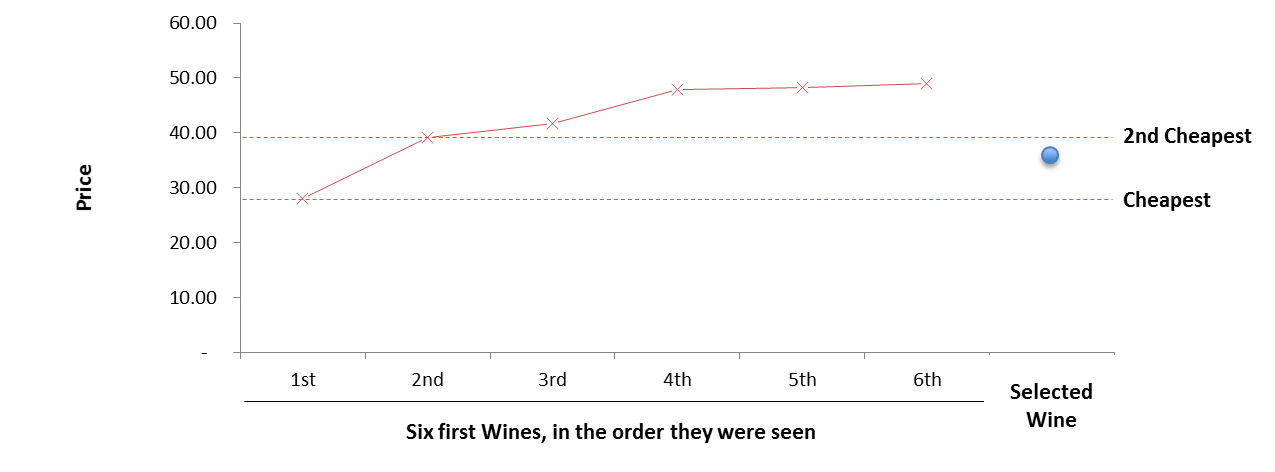
Note: We will show later in this blog that 6 wines allow for most people to see their pick. Also, note that the selected wine was not necessarily the 7th seen wine, as it seems to be implied by the chart.
So, putting aside the fact that these “seen” wines are actually tapped (thus the user must have seen other wines), there are a few interesting aspects regarding the average user behavior:
- It appears that restaurant customers follow a “low-to-high” approach regarding the wine prices they are interested in. It’s unclear at this moment how much does the sorting of the list it self play into this;
- The selected wine is, on average, in the low range of the wines the customer saw, which is somewhat compatible with the second cheapest rule.
Now, the problem with averages is that it could be the case that there are simply a lot of users picking wines above and below the second cheapest, which yields an average price close to the second cheapest wine. We decided to breakdown the numbers in the individual choices.
Who Picks the Cheapest Wine
The chart below shows how the chosen wine ranks within the wines the user saw. For instance, the first bar shows that 21% of users pick the cheapest wine they see on the list.

It is less clear now that the Second Cheapest rule applies. Still, we would like definitive proof that the Second Cheapest Wine is not a good predictor of the consumer’s pick.
Who Picks the Second Cheapest Wine
The following chart shows a sample of the full data set. Points along the blue line are users who pick the Second Cheapest wine. Points above and below that line are users who respectively chose wines with prices above and below the second cheapest.

If the Second Cheapest Rule were to apply, we would need to see either
- a trend where the people who have seen a “more expensive Second Cheapest” actually pick a more expensive wine;
- a clear trend where, for any price, the Second Cheapest will have more picks than the others.
Overall the Second Cheapest Rule doesn’t seem to apply. However, a few questions can be raised after analyzing these charts:
- Can restaurants push the cheapest wine up to drive a higher ticket price? What’s the elasticity of the wine consumer (i.e. how many people will stop drinking wine vs how many will actually pick a pricier one)?
- Is the sorting of the list playing an effect here? Most wine lists are sorted by price, which drives the consumer to set the baseline expectation on the cheapest wine. Could this be driving their decision?
- What is the effect of the Second Cheapest wine on customers who drink more than one bottle of wine?
- We focused our analysis on the Cheapest wine the user saw. For long lists this might be significantly different from the cheapest wine on the list, or the cheapest one on the category the user is interested in (Red, White, French, Sparkling, etc.). This raises the question if long wine lists drive any trends regarding the price of the selected wines.
We want to continue analyzing this issue. In particular, we’ll soon look at how browsing through more or less wines might have any kind of influence, and how should restaurants address the “wine list size” issue. The other questions could definitely be the subject of a few A/B tests we want to try soon.
For now, the conclusion seems to be that the Second Cheapest rule does not exist, or at least does not apply to the user base of our sample restaurants.
It looks like the LAB TEAM is off to a great start! A/B testing (scientist-speak for trying one type on some customers, and another type on the rest) could definitely shed some light on the issue.
On a side note, if you’re unsure about the benefits of the iPad wine list for your restaurant, the WSJ article mentioned above could be interesting for you!